Photo by Crawford Jolly on Unsplash
Raw data can be very messy and machine learning models only want well-structured and clean data. Data wrangling is the most important and essential step in transforming raw data into a more functional form. With a properly wrangled data, you will be able to create informative data visuals and also build a highly accurate model in order to make better predictions. Machine Learning follows the garbage-in/garbage-out principle. If you want to learn from or predict based on your data, you need to make sure that data is well constructed, clean and suitable for your machine learning model.
Pandas which was built on Numpy is a top python library, that was developed for data manipulation and analysis and is the most preferred for data wrangling in python.
Data wrangling/munging with pandas is one of the most overlooked aspects of a data science project. It is also a difficult and time consuming part of a typical data science project in the real world because data scientists/analysts spend almost 80 percent of their time in cleaning messy data. Data wrangling involves accessing the data, sorting, reshaping and many more.
If you are using the anaconda distribution, many python libraries have been installed by default. Import pandas and use the conventional alias ‘pd’.


If pandas is not available by default , you can install as follows:


You can read more about pandas here and also check the official documentation to understand the structure of pandas.
Importing data
Data is stored in different forms such as flat files like csv, tsv, spreadsheets such as excel, sas), Stata, matlab, plain text and also in databases, structured data stored in relational databases can be retrieved using SQL. All these data formats can be imported, manipulated, and wrangled in pandas. I will be writing on how to import different file formats with pandas in the future. This is a typical way of importing a csv file with pandas.

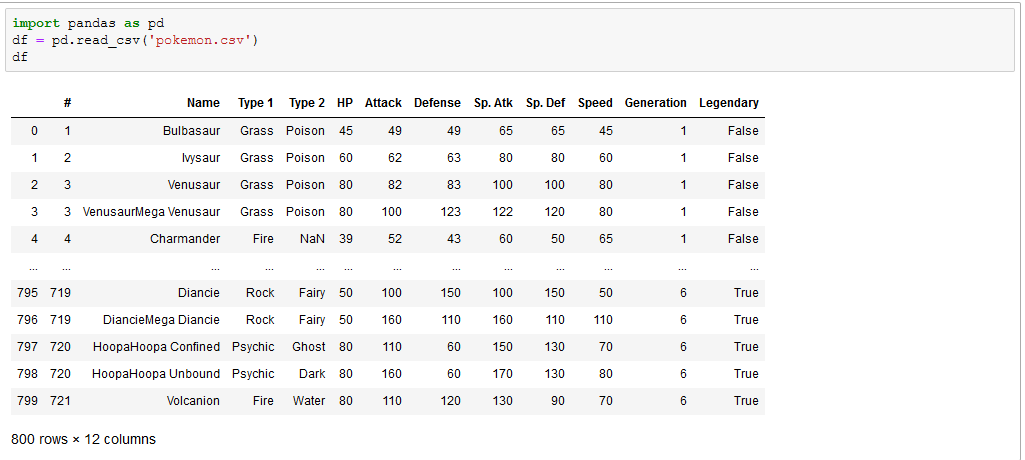
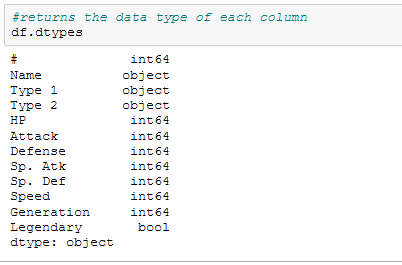
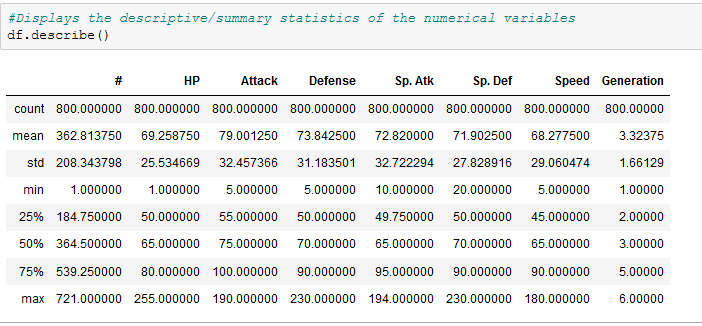
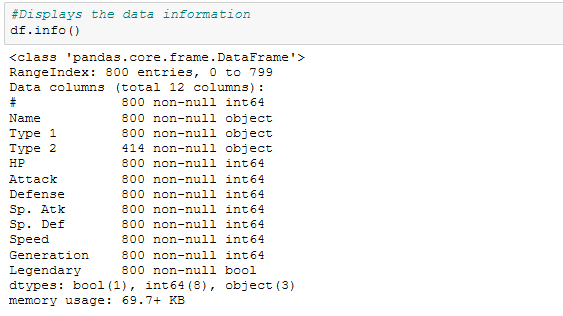
To get a better understanding of the data, this section lists some of the operations commonly used to gain better understanding of what a dataframe contains.




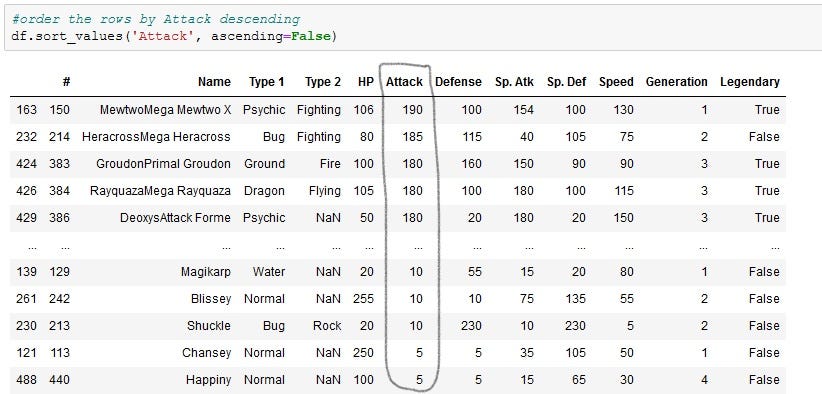
sort_values function is used to sort the dataframe in ascending (which is the default) order or descending (ascending is set to False) order.

Pandas has a merge function which can be used to combine two dataframes. It is similar to joins in SQL which is used to combine observations from different dataframes.
I created dataframes from dictionaries ,some cities in Canada as keys,temperature(in degree Celsius) and humidity as values.

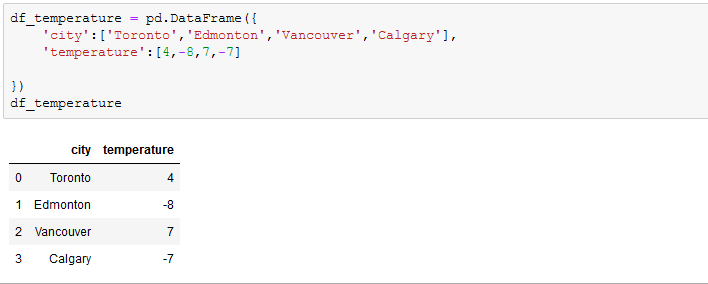

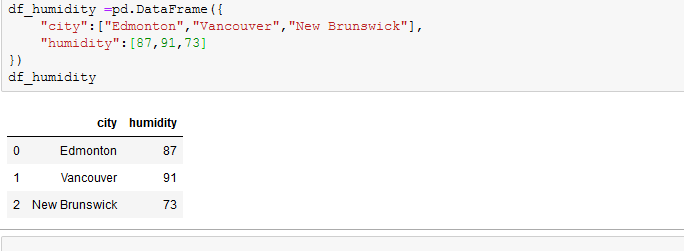


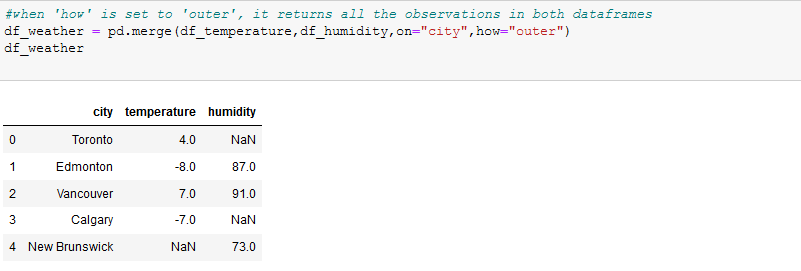
when ‘how’ was set to ‘inner’, the common cities in the two dataframes were returned in a new dataframe, just like intersection in sets.When ‘how’ is set to ‘outer’, just like union in sets, the two dataframes are combined and returned in a new dataframe, if an observation exists in just a dataframe, NaN is returned in the column where it doesn’t exist. ‘how’ can also be set to ‘left’ and ‘right’. You can go through the documentation to see all that can be done with the merge function.
Columns can be renamed using the rename operation. You can read more about rename here.Suppose we want to change the first letters of the column names in the weather_df dataframe from lowercase to uppercase, we do so as follows:


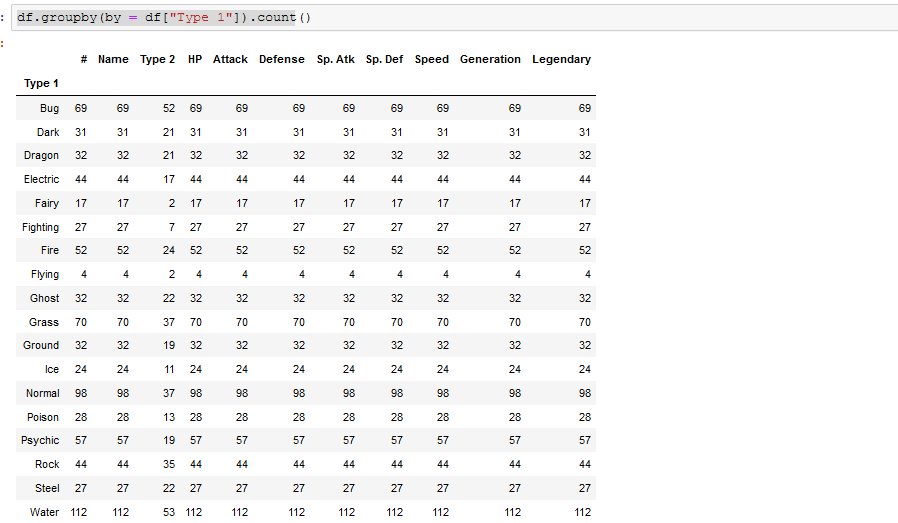
A groupby can be used to group data and perform operations based on the groups.it involves combination of splitting , applying a function, and combining the results. Using our pokemon.csv, let’s count the number of each Type 1 by grouping the data by ‘Type 1’.

Inspecting Missing Values
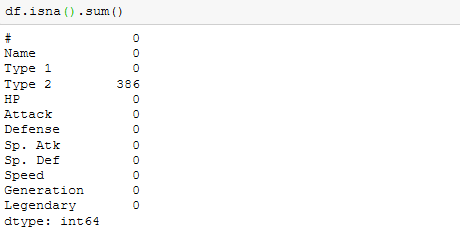
Missing values in data is a common occurrence, the reasons could be due to human or technical errors.We need a lot of data to gain better insights, the larger the data, the better the performance of a machine learning model. It is vital to evaluate the missing values. Before dealing with missing values, the problem must be well understood,are there too many missing values and how many are there? are they missing randomly? is there a pattern? can other observations help with getting the values for the missing values? missing values can be dealt with in different forms. They can be dropped or replaced by different methods. A common method is replacing missing values with measures of central tendency.
We can sum up the total missing values using :
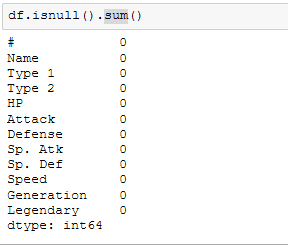
df.isnull().sum()
#or
df.isna().sum()

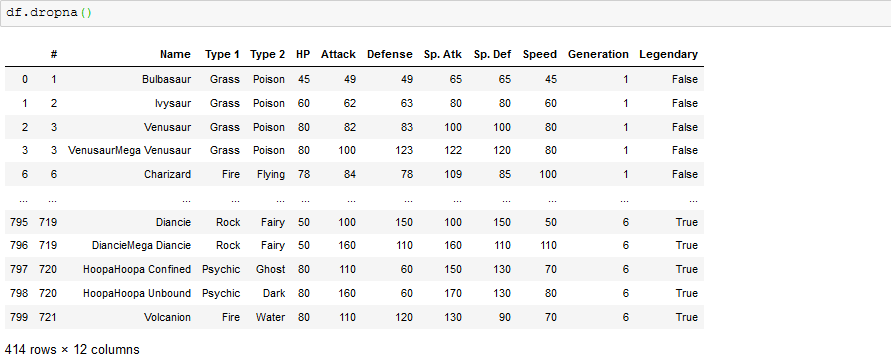
Depending on how you choose to deal with the missing values, you can drop the missing values as follows:

we can confirm that the rows containing the missing values have been dropped.

we can see that the rows with missing/null values have been dropped and the number of rows is 414 compared to 800 in the initial dataframe. A lot of rows have been dropped and hence a whole lot of information will be lost. Instead of dropping the missing values, we can fill them all with mean,median,max,mode,zeros and so on, we can also fill each column separately depending on how well we understand the data.
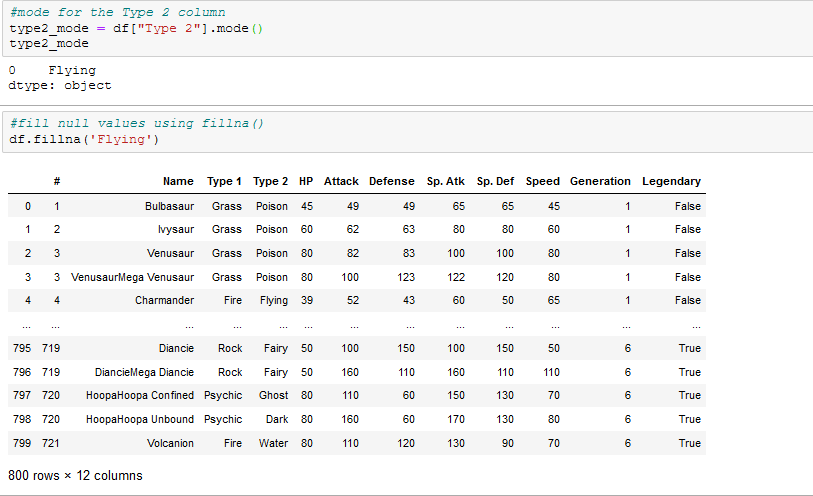
we can fill the missing values with the mode of the Type 2 column using .fillna():

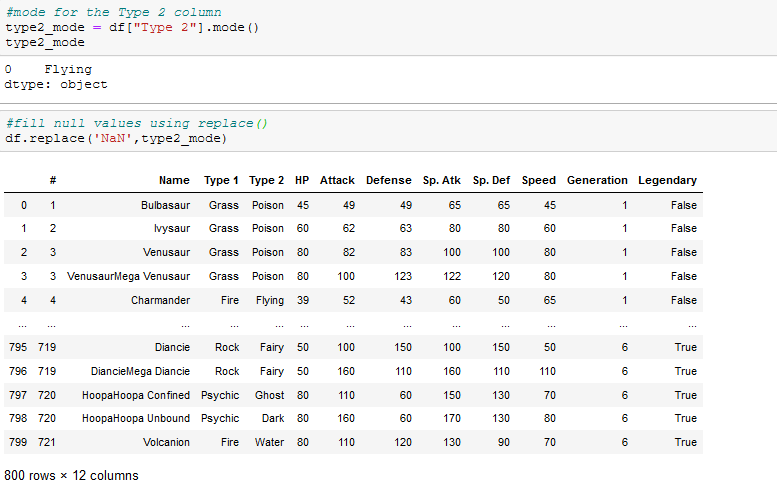
or fill missing values using .replace()

Pandas objects such as dataframe and series can easily be exported to external files and saved to directory in your local machine, they can be stored in different formats using to_csv,to_sql,to_excel to_hdf, to_json, to_html and so on.
we can save the weather_df dataframe to csv with the name ‘weather’ as follows:


There are many other data wrangling operations that were not discussed here.Do you know any? Drop them in the comments section below and share useful information about them.
Thank you for reading.
