# Data Manipulation with python pandas
Photo by [Sophie Elvis](https://unsplash.com/@thetechnomaid?utm_source=medium&utm_medium=referral) on [Unsplash](https://unsplash.com?utm_source=medium&utm_medium=referral)
Data has to be manipulated and cleaned so that it can provide useful insights. Data manipulation is a necessity as there is an increasing amount of data being stored and used.
This article explains some of the data manipulation operations that can help with organizing our data and extracting useful insights.
Pandas, as explained [here](https://medium.com/better-programming/top-10-python-libraries-for-data-science-21e6cd95ca55), is an open-source python library that implements easy, efficient, high-performance data analysis tools. Pandas provide efficient access to data [wrangling](https://medium.com/better-programming/data-wrangling-with-pandas-57f7f72fe73c)/munging tasks that occupy almost 80 percent of a data scientist’s time. There are different ways to store data for analysis: rectangular data or tabular data containing rows and columns is the most common form.
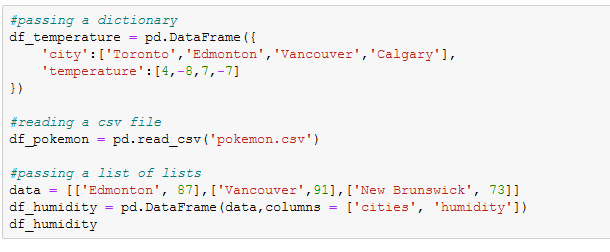
Tabular data is represented as a Dataframe object in pandas. Every value within a column of the Dataframe has the same data type, either text or numeric but different columns can contain different data types. Dataframes can be created in various ways, like passing in a dictionary, list of lists, reading from a flat-file such as CSV.

How to Install, import pandas, and explore the data has been shown [here](https://medium.com/better-programming/data-wrangling-with-pandas-57f7f72fe73c).
**Sorting**
Sorting is one of the two most important ways to find interesting parts in the Dataframes. `sort_values()`sorts rows. When the column name is passed into the method, the data by default gets sorted in ascending order. `ascending` is set to `False` to sort in descending order. When a list of columns is passed to the `sort_values()`method to sort rows, `ascending`is set to a list of booleans corresponding to the number of the columns to sort in different orders.

**Subsetting**
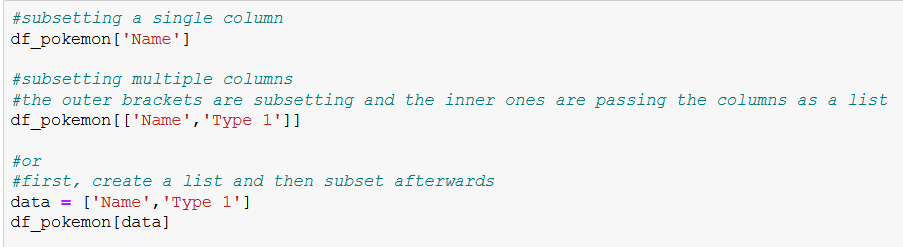
A large part of data science is about finding which interesting bits in your dataset. Simple techniques, sometimes known as filtering or selecting rows, are used to find a subset of rows that match some criteria. We can filter single, multiple columns, and text data.
There are many ways to subset a DataFrame: the most common is using relational operators to return `True`or `False` for each row, then passing them into square brackets.

we can subset rows by creating a logical condition to filter against, the result is a column of booleans


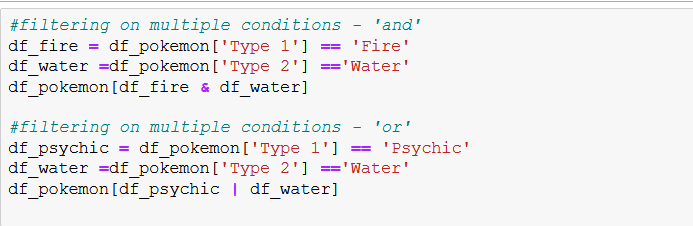
we can filter on multiple conditions by using logical operators, the bitwise ‘and’/ampersand(&) and ‘or’/pipe (|)

**New columns**
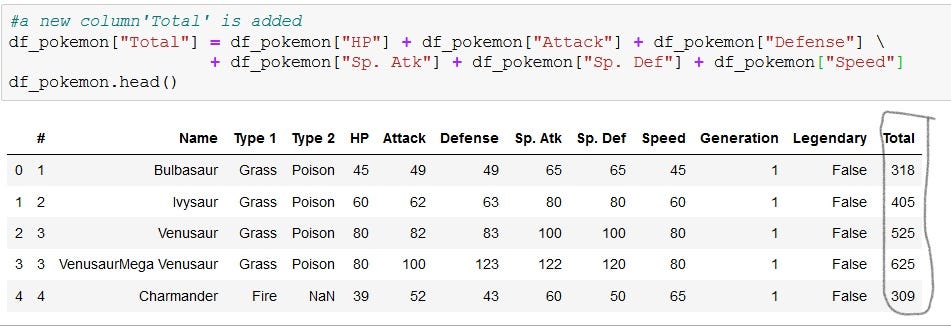
We might need to create a new column from the existing columns. Creating a new column can also be called mutating a Dataframe, transforming a Dataframe, and feature engineering.


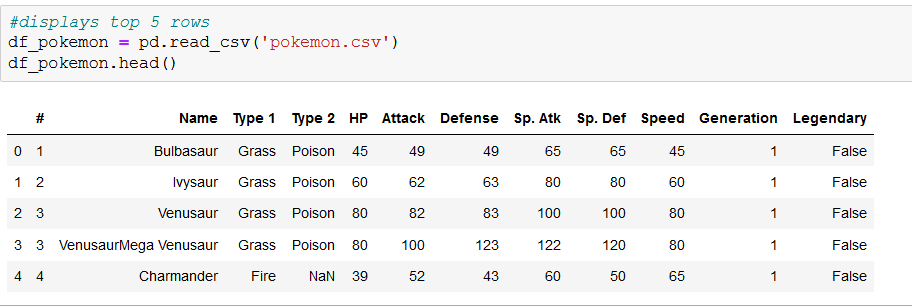
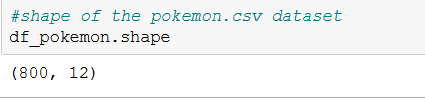
From our data,we can confirm by checking the shape of the new column. The number of columns increased by one from 12 to 13.


We have seen the four most common types of data manipulation: sorting rows, subsetting columns, subsetting rows, and adding new columns. What other data manipulations operations do you know?
 How to Install, import pandas, and explore the data has been shown [here](https://medium.com/better-programming/data-wrangling-with-pandas-57f7f72fe73c).
**Sorting**
Sorting is one of the two most important ways to find interesting parts in the Dataframes. `sort_values()`sorts rows. When the column name is passed into the method, the data by default gets sorted in ascending order. `ascending` is set to `False` to sort in descending order. When a list of columns is passed to the `sort_values()`method to sort rows, `ascending`is set to a list of booleans corresponding to the number of the columns to sort in different orders.

How to Install, import pandas, and explore the data has been shown [here](https://medium.com/better-programming/data-wrangling-with-pandas-57f7f72fe73c).
**Sorting**
Sorting is one of the two most important ways to find interesting parts in the Dataframes. `sort_values()`sorts rows. When the column name is passed into the method, the data by default gets sorted in ascending order. `ascending` is set to `False` to sort in descending order. When a list of columns is passed to the `sort_values()`method to sort rows, `ascending`is set to a list of booleans corresponding to the number of the columns to sort in different orders.

 **Subsetting**
A large part of data science is about finding which interesting bits in your dataset. Simple techniques, sometimes known as filtering or selecting rows, are used to find a subset of rows that match some criteria. We can filter single, multiple columns, and text data.
There are many ways to subset a DataFrame: the most common is using relational operators to return `True`or `False` for each row, then passing them into square brackets.

**Subsetting**
A large part of data science is about finding which interesting bits in your dataset. Simple techniques, sometimes known as filtering or selecting rows, are used to find a subset of rows that match some criteria. We can filter single, multiple columns, and text data.
There are many ways to subset a DataFrame: the most common is using relational operators to return `True`or `False` for each row, then passing them into square brackets.

 we can subset rows by creating a logical condition to filter against, the result is a column of booleans

we can subset rows by creating a logical condition to filter against, the result is a column of booleans

 

 we can filter on multiple conditions by using logical operators, the bitwise ‘and’/ampersand(&) and ‘or’/pipe (|)

we can filter on multiple conditions by using logical operators, the bitwise ‘and’/ampersand(&) and ‘or’/pipe (|)

 **New columns**
We might need to create a new column from the existing columns. Creating a new column can also be called mutating a Dataframe, transforming a Dataframe, and feature engineering.

**New columns**
We might need to create a new column from the existing columns. Creating a new column can also be called mutating a Dataframe, transforming a Dataframe, and feature engineering.


 From our data,we can confirm by checking the shape of the new column. The number of columns increased by one from 12 to 13.

From our data,we can confirm by checking the shape of the new column. The number of columns increased by one from 12 to 13.


 We have seen the four most common types of data manipulation: sorting rows, subsetting columns, subsetting rows, and adding new columns. What other data manipulations operations do you know?